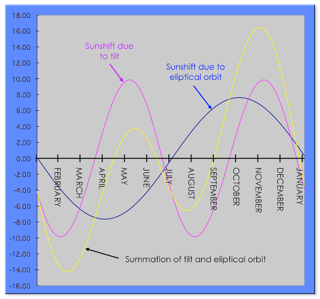
The analemma and the Equation-of-Time are a result of the sum of the effects of the Earth’s elliptical orbit around the sun and the tilt of the Earth’s axis in relation to the plane of its orbit around the sun. The following chart shows the effect of this summation.
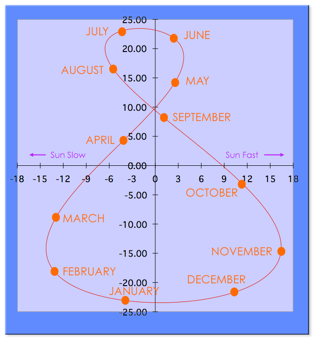
The following diagram shows the position of the true sun in the sky throughout the year. The y–axis on the chart represents the declination (Earth's tilt) of the sun in the sky for one year, going from –23.45° in the winter to +23.45° in the summer. The x–axis represents the difference in time from what your watch tells you what the position of the sun should be to the actual position of the sun in the sky. Note that the figure-8 is slightly skewed due to the effect of the apse angle.
Let’s go back inside the celestial sphere and watch the path of the true sun making the analemmic curve. The speed of the true sun on the ecliptic now reflects its elliptical orbit around the sun, moving faster in January and slower in July. This results in the analemma having the bulge at the bottom half of the figure-8 shape.
And finally, here's a view from the sun looking back towards the Earth.